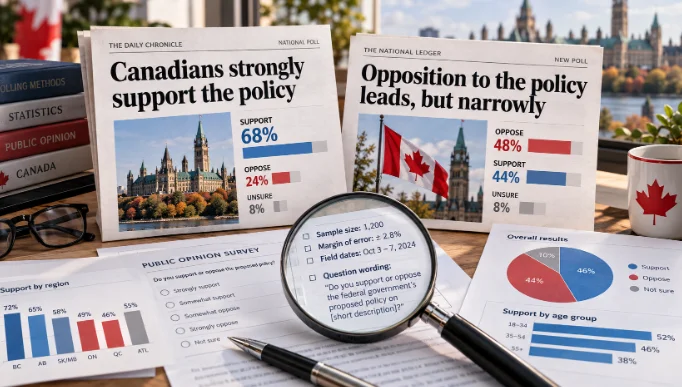
How to Read Opinion Polls Without Being Misled

A headline announces that most Canadians support a proposed policy. Another survey finds a narrow lead for the opposite view. Both may come from legitimate research organizations, yet the apparent contradiction leaves readers wondering which result to believe.
Reading an opinion poll properly means looking beyond the headline percentage. You need to know who answered, how they were selected, what they were asked and how much uncertainty surrounds the results. A poll can be carefully conducted and still support a much narrower conclusion than the accompanying news story suggests.
What an opinion poll actually tells you
An opinion poll measures the responses of a particular group of people during a defined period. Researchers may use those answers to estimate the views of a larger population, but the strength of that estimate depends on how the survey was designed.
A finding that 60% of respondents support a proposal does not automatically mean 60% of the population supports it. That broader conclusion requires evidence that the respondents adequately represent the population being discussed.
A snapshot is not a prediction
Public opinion changes. A survey conducted before a major announcement may capture different attitudes from one conducted afterward. Even when researchers use sound methods, their results describe opinion during the survey’s field dates, not necessarily what people will believe or do months later.
This distinction matters when journalists describe a poll as evidence that a policy will succeed, consumers will change their behaviour or voters will make a particular choice. Expressed intentions do not guarantee future actions.
When comparing polls, check their field dates before looking at the differences in percentages. Two surveys conducted weeks apart may be recording genuine changes in opinion rather than disagreeing about the same moment.
The question matters as much as the answer
Consider two hypothetical questions about public transit:
- “Do you support increasing investment in public transit to improve accessibility and reduce congestion?”
- “Do you support increasing government spending on public transit, even if it requires additional public funding?”
Both concern transit investment, but the first emphasizes potential benefits while the second emphasizes cost. Respondents may interpret them differently, so their answers are not interchangeable.
Response options matter too. A survey offering “strongly support,” “somewhat support,” “somewhat oppose” and “strongly oppose” measures attitudes differently from a simple yes-or-no question. If a headline combines strong and moderate support, readers should be able to see that distinction.
The Canadian Research Insights Council (CRIC) includes disclosure of question wording and response options in its public opinion research standards. If only the headline result is available, an important part of the evidence is missing.
Read the methodology before the headline
A poll’s methodology explains how researchers obtained the numbers. It is often found beneath the article, in an accompanying report or in a separate technical document.
A useful methodology statement identifies the target population, sample size, field dates, selection method, data collection mode, weighting procedures and research sponsor. For probability surveys, it should also explain the applicable sampling uncertainty.
Who was surveyed?
Start with the target population. A survey of Canadian adults aged 18 and older is different from one of registered voters, employed adults, homeowners or residents of British Columbia.
Even a large survey cannot support conclusions about people who were excluded from its target population. A poll of 1,500 Canadian homeowners, for example, cannot establish what all Canadian residents think about housing affordability.
Pay attention to the difference between the target population and the final group of respondents. Researchers may intend to represent all adults but have difficulty reaching certain groups. The methodology should explain how those limitations were addressed.
How were respondents selected?
Two major sampling approaches appear in Canadian public opinion research.
Probability sampling uses a selection process in which eligible members of the target population have known, non-zero probabilities of being selected. Properly designed probability surveys allow researchers to estimate sampling uncertainty using established statistical methods.
Non-probability sampling selects respondents without known selection probabilities for everyone in the target population. Many online opinion panels recruit volunteers who agree to participate in future surveys. Researchers can use demographic quotas, weighting and quality controls to improve the usefulness of these samples, but conventional probability-based margins of sampling error do not automatically apply.
Online does not necessarily mean non-probability. A survey may recruit a probability sample and collect responses online. Conversely, a telephone survey is not automatically a probability survey. How participants were selected matters more than the device used to answer.
An open-link poll on a news website is a different case again. Visitors choose whether to participate, and those with strong opinions may be especially motivated to respond. Even tens of thousands of answers cannot turn such a poll into a representative population estimate.
CRIC’s requirements for open-link surveys specifically recognize risks involving selection bias, duplicate responses and organized attempts to influence results.
Weighting also deserves attention. Researchers may adjust the influence of responses to better reflect known population characteristics such as age, gender or region. This can correct certain imbalances, but it cannot guarantee that unmeasured differences between respondents and non-respondents have disappeared.
Who paid for the research?
Knowing the sponsor helps readers understand why a study was commissioned and which questions it was designed to investigate.
A transit advocacy organization may commission research about transportation priorities. A business association may survey attitudes toward regulatory changes. Neither sponsorship automatically invalidates the results, but transparency makes the findings easier to assess.
Look for the commissioning organization, the firm that conducted the research and the availability of the complete questionnaire. An independent research firm using a disclosed method provides more information to evaluate than an anonymous graphic circulating on social media.
CRIC’s disclosure requirements apply to its members, while Public Services and Procurement Canada maintains separate standards for specified public opinion research commissioned by the federal government. These are not universal legal requirements governing every survey published in Canada, but they provide useful benchmarks for transparency.
What margin of error does and does not mean
A margin of error describes sampling uncertainty under a specified statistical method. It does not measure every possible problem with a survey.
Suppose an appropriately designed probability survey estimates support at 48%, with a margin of sampling error of plus or minus three percentage points at a 95% confidence level. The corresponding interval is approximately 45% to 51%.
The 95% confidence level means that, over many repetitions of the sampling procedure, intervals constructed this way would contain the true population value about 95% of the time. It does not mean there is a 95% probability that the particular completed interval contains the fixed population value.
Statistics Canada’s guidance on survey interpretation makes another crucial distinction: sampling error is only one component of survey uncertainty. Question wording, coverage problems, non-response and inaccurate answers can affect results without being captured by the published margin.
A three-point lead may not be decisive
Imagine a survey reporting 48% support and 45% opposition to a proposal, with 7% undecided.
Support leads opposition by three percentage points in the sample. That is a factual description of the reported figures. Whether the difference is statistically distinguishable from zero requires an appropriate comparison that accounts for the survey design and the relationship between the response categories.
It would be premature to describe the finding as a decisive victory for supporters simply because 48 is greater than 45.
Overlapping confidence intervals can be a warning against overinterpretation, although overlap alone is not a formal significance test. A proper comparison needs the uncertainty of the difference itself.
Why online polls may not report a traditional margin of error
For opt-in non-probability samples, researchers generally cannot calculate a conventional design-based margin of sampling error because respondents were not selected with known probabilities.
Canada’s federal online public opinion research standards require clear disclosure when results from non-probability samples cannot be statistically projected to the target population with a known margin of sampling error.
CRIC likewise distinguishes probability-based margins of error from model-based precision estimates that may be used for some non-probability research, provided the assumptions and calculation methods are disclosed.
A non-probability survey is not necessarily worthless. Well-managed panels can provide useful information about attitudes and emerging patterns. The problem arises when their findings are presented with a degree of statistical certainty the method cannot establish.
National numbers can hide regional differences
Canada-wide results do not necessarily describe the attitudes of people in British Columbia, Alberta, Quebec or any other individual province.
Canada-wide results versus British Columbia results
Imagine a national survey finding that 48% of adults favour increased public transit funding. That result combines responses from across the country, potentially with regional weighting to reflect the population.
It does not establish that 48% of BC residents share the same opinion. Their responses may differ because of transportation infrastructure, population density, public services or other local circumstances.
To make a defensible provincial claim, look for the BC-specific result, the actual number of respondents from the province and the uncertainty associated with that estimate.
National and regional results may also reflect different questions or eligibility rules. Before comparing surveys, verify that they measured the same issue in a comparable way.
Small subgroups carry greater uncertainty
A survey of 1,200 adults may sound substantial, but a provincial, age-based or language-based subgroup can contain far fewer respondents.
Smaller probability samples generally produce less precise estimates. Weighting and complex survey designs may further affect that precision.
A difference of several percentage points between two provincial results may therefore be too uncertain to support a firm conclusion. The appropriate uncertainty estimate should be calculated for the relevant subgroup, not borrowed from the national sample.
Watch for headlines that compare detailed demographic categories without reporting how many people actually answered in each one.
Read a sample poll from start to finish
The following example is entirely fictional and is provided to demonstrate how a poll should be interpreted. It does not describe research that was actually conducted.
Suppose a research organization publishes a survey asking Canadian adults about a proposed increase in federal funding for local public transit.
The fictional methodology reports:
- Target population: Canadian adults aged 18 and older.
- Field dates: May 4–10, 2026.
- Sample: 1,200 respondents selected using a documented probability-based telephone sampling design.
- Weighting: Age, gender and region, with relevant survey-design adjustments.
- National result: 48% support, 45% oppose and 7% are unsure.
- Sampling precision: An illustrative national margin of approximately ±3 percentage points at a 95% confidence level for estimates near 50%, assuming the described design supports that calculation.
- BC subgroup: 140 respondents, with 56% support, 37% opposition and 7% unsure.
The hypothetical survey also asks whether respondents would support the proposal if it resulted in higher federal spending. That wording should be published in full, along with the question order and any introductory information respondents received.
What the headline suggests
Consider three possible headlines based on this fictional survey:
| Headline | Editorial assessment |
|---|---|
| “Canadians overwhelmingly back transit funding increase” | Misleading. National support is below 50%, and the support–opposition difference is narrow. |
| “British Columbians strongly favour new transit spending” | Overconfident. The BC subgroup result is based on a comparatively small sample and requires a provincial uncertainty assessment. |
| “Poll finds Canadians divided over proposed transit funding increase” | More defensible. It reflects the relatively close national results without claiming an established majority. |
What the methodology supports
The national findings suggest that support and opposition were relatively close during the survey period. The three-point observed difference alone does not establish a clear population lead.
The BC result suggests a higher level of support among surveyed provincial respondents, but a subgroup of 140 produces considerably more sampling uncertainty than the full national sample. Its estimate should not be treated as having the same precision as the national figure.
Nor can the survey establish that funding would receive majority support once voters learned more about costs, implementation or alternative spending priorities. Those are separate questions.
Even a carefully conducted poll can produce a misleading headline, which is why understanding how numbers can be misleading in the news matters beyond survey methodology.
How a careful news report would phrase the finding
A restrained headline would be: “Survey finds Canadians closely divided on proposed transit funding increase.”
The accompanying report could state that 48% of respondents expressed support and 45% opposition, while explaining the survey period, sampling method and uncertainty. It might also note the higher observed support in the BC subgroup without presenting that regional finding as definitive.
That wording is less dramatic, but it gives readers a more accurate account of what the evidence can support.
Five questions to ask before quoting a poll
When a survey result appears in your feed, these five questions can help you decide whether to trust or repeat it:
- Who was actually surveyed? Identify the target population, location and respondent eligibility criteria.
- How were participants selected? Distinguish probability sampling, recruited online panels and open-link surveys.
- What exactly were respondents asked? Check the full question, response choices and any wording that may influence the answers.
- How uncertain are the findings? Look for appropriate sampling or model-based precision information and consider subgroup sizes, weighting and possible bias.
- Does the headline match the evidence? Separate the observed result from claims about a majority, a meaningful lead, a regional consensus or future behaviour.
If the methodology is missing, search for the original report from the research organization rather than relying on a news summary or social media graphic. A credible poll should provide enough information for readers to assess how its findings were produced.
Opinion polls are most useful when treated as estimates with identifiable strengths and limitations, not as votes that have already been counted. Reading the method behind the number lets you recognize what people actually said, how confidently the result can be generalized and where the evidence stops.