How to Spot Misleading Statistics in News and Social Media

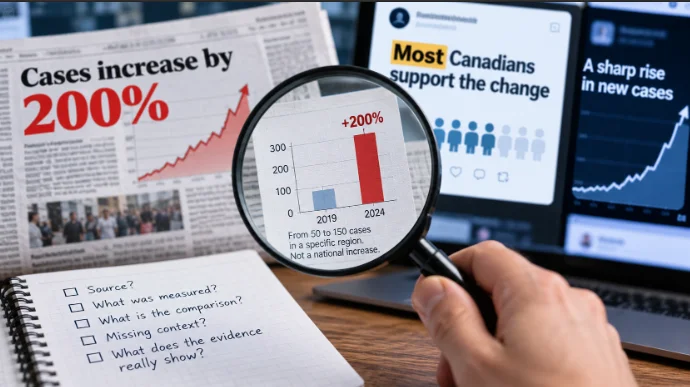
A headline says something has increased by 200%. A chart shows a line climbing almost vertically. A survey claims that most Canadians support a proposed change. Each appears to offer solid evidence, but none tells you enough to judge the claim on its own.
Misleading statistics are not always fabricated. Often, the numbers are real but the comparison is selective, the population is misunderstood or the uncertainty has disappeared between the original research and the headline. Learning to recognize those gaps is one of the most useful skills for reading news critically.
To check a statistical claim, identify the original source, establish what was actually measured, examine the comparison and look for missing context. The goal is not to distrust every number. It is to understand what the evidence can reasonably support.
Why accurate numbers can still tell a misleading story
Numbers carry an appearance of objectivity. A statement that “conditions are getting worse” is clearly an interpretation. Add a precise percentage and it suddenly sounds like a finding that has been scientifically established.
Yet statistics are produced through choices. Someone decides what to measure, which observations to include, how to group the results and which comparison deserves attention. Those decisions may be entirely reasonable, but readers need enough information to understand them.
The number may be right while the conclusion is wrong
Suppose a town records six incidents of a particular kind this year, compared with two last year. A headline announcing a 200% increase would be mathematically correct.
But a claim that the town is experiencing an unprecedented crisis would require considerably more evidence. Six incidents may be serious, but the percentage alone cannot establish how unusual they are, whether reporting practices changed or how the figures compare with previous years.
The distinction is between what the data show and what someone concludes from them. The first may be verifiable while the second remains speculative.
Missing context changes what readers understand
Consider Statistics Canada’s Labour Force Survey for September 2026, released on October 9. It reported that Canada’s unemployment rate increased by 0.1 percentage points to 6.5%.
A headline describing unemployment as “rising” would be supported by the monthly comparison. Calling it an uninterrupted surge would be much harder to justify. The rate had reached 6.9% in April before declining to 6.4% in July and August.
Both the monthly increase and the earlier decline are genuine. They simply answer different questions.
Statistics Canada’s December 2025 resource, Assessing Data in a Time of Misinformation: A Step-by-Step Guide, encourages readers to examine sources, methods, definitions, accuracy and context. These checks are valuable precisely because a credible dataset can still be interpreted poorly.
Six common ways statistics become misleading
Misleading figures tend to follow recognizable patterns. Some exaggerate a change, while others conceal differences between groups or present uncertain findings as established facts.
Choosing a convenient starting point
A comparison can look dramatic when the starting date is chosen carefully.
Imagine a measure that reaches 100, falls to 70 and later recovers to 90. Reporting an increase from 70 to 90 highlights a substantial recovery. Comparing 90 with the earlier value of 100 shows that the measure remains below its original level.
Both comparisons are accurate. Neither provides the complete history.
This problem appears in economic reporting, housing statistics, retail sales and public service performance. A chart beginning during an unusually weak period may make an ordinary recovery look exceptional. Starting at an unusually strong period can make a later result look disproportionately poor.
When a headline makes a broad trend claim, look beyond the two dates it selected. A longer series may reveal seasonal movements, earlier peaks or an established pattern that the short comparison conceals.
Using percentages without showing the totals
Percentages describe relative size, but they do not tell you how many people or events are involved.
Consider two hypothetical reports:
- A service receives three complaints instead of one, a 200% increase.
- Another service receives 30,000 complaints instead of 10,000, also a 200% increase.
The relative change is identical, but the scale is very different.
Another common confusion involves percentages and percentage points. If support for a proposal increases from 10% to 15%, the rise is five percentage points, equivalent to a 50% relative increase. Saying support increased “by 5%” would be ambiguous and potentially inaccurate.
For rates involving population, travel or service usage, check the denominator. A rising number of incidents may coexist with a falling rate per 100,000 residents or per million journeys if the relevant population or activity has grown faster.
That does not make the rising count irrelevant. It means that counts and rates describe different aspects of the situation.
Comparing groups that are not equivalent
A comparison is meaningful only when the underlying measures are sufficiently alike.
Suppose one report counts all hospital visits while another counts only emergency department visits. Comparing their totals as though they describe the same service would be misleading, even if both figures are accurate.
Geography creates similar problems. A Canada-wide unemployment rate cannot be presented as British Columbia’s rate. Nor can a provincial average automatically describe conditions in a particular city.
Definitions matter too. The unemployment rate measures unemployed people as a proportion of the labour force, not everyone in the population who lacks a job. A change in this rate cannot automatically be interpreted as an equivalent change in the number of layoffs.
Before accepting a comparison, establish that the population, period, units and definitions are compatible.
Confusing correlation with causation
Two things happening together do not establish that one caused the other.
Ice cream sales and swimming-related incidents might both increase during hot weather. That relationship would not demonstrate that buying ice cream causes dangerous swimming behaviour. Temperature and outdoor activity provide more plausible explanations for the shared pattern.
The same reasoning applies to serious news topics. A community may introduce a new program shortly before a measurable improvement, but timing alone cannot establish whether the program caused the change.
Researchers may use controlled experiments, comparisons with similar groups, statistical models and other methods to investigate causal relationships. Each approach has limitations, and evidence from observational data generally requires careful consideration of alternative explanations.
Watch for headlines that turn “associated with” into “causes,” particularly when the underlying research is observational.
Reporting averages without showing the distribution
An average can conceal substantial differences within a group.
Consider seven hypothetical annual incomes: C$35,000, C$42,000, C$45,000, C$46,000, C$47,000, C$50,000 and C$300,000.
The arithmetic mean is approximately C$80,700, but the median is C$46,000. One unusually high income pulls the mean far above what most people in the group earn.
Neither measure is inherently wrong. The mean describes the total divided by the number of observations. The median identifies the middle value when observations are ordered.
For skewed distributions, the median may better represent a typical observation. For understanding total resources distributed across a population, the mean can be useful. Percentiles and other measures provide additional context.
Whenever a news story reports an “average,” ask which average was calculated and whether the distribution makes that measure informative.
Leaving uncertainty out of the headline
A statistical estimate is not necessarily an exact count.
Surveys depend on samples, and samples introduce uncertainty. Researchers may report confidence intervals, standard errors or other quality indicators to describe the precision of their estimates.
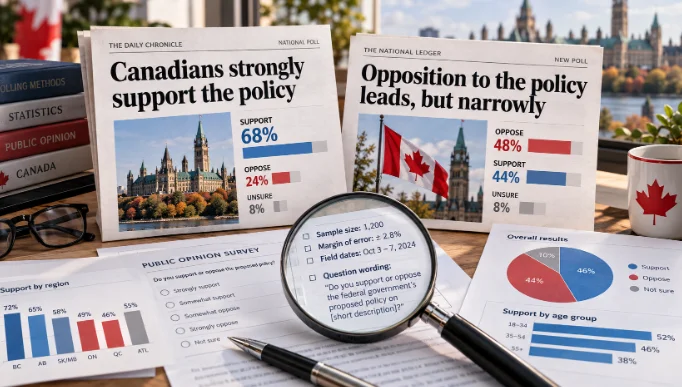
Suppose a probability survey reports 48% support and 45% opposition. The observed difference is three percentage points, but that alone does not establish a statistically meaningful lead. Evaluating the difference requires information about sampling, weighting and uncertainty.
The same caution applies to subgroup comparisons. A survey of 1,500 people may contain only a small number of respondents from one province or demographic category.
Not all uncertainty comes from sampling. Incomplete coverage, non-response, inconsistent reporting and measurement problems can also affect results.
A precise-looking percentage should not be mistaken for certainty about the underlying population.
Check the source before judging the number
The most useful way to verify a statistical claim is to work backwards from the article or social media post to the original evidence.
The SIFT method provides a practical starting point: Stop, Investigate the source, Find better coverage and Trace claims to their original context.
Trace the claim to its original dataset
Begin by identifying the exact figure and the organization said to have produced it. Search for the percentage alongside a distinctive phrase, publication date or research title.
A news article may cite a press release, which summarizes a study, which draws on a larger dataset. Each step can introduce rounding, selective emphasis or missing context.
When a headline gives you a surprising number but no clear evidence, the next step is to trace a news statistic to its original source before deciding what it means.
For Canadian government statistics, Statistics Canada’s The Daily provides official releases, while its data tables offer more detailed observations and methodological information. Other federal and provincial agencies maintain their own datasets and reporting frameworks.
A source is not automatically unreliable because it comes from a private organization. What matters is whether the evidence can be examined and whether the methods are appropriate for the claim.
Check the definitions and collection method
Finding the original study is only the beginning.
Look for the target population, reporting period, collection method, sample selection and relevant exclusions. If a survey describes “Canadian consumers,” determine whether it included everyone, only adults, online panel members or customers of a particular business.
Check whether estimates have been revised. Statistical agencies sometimes update historical figures as new information becomes available or methods improve. An older article may accurately report the figures available at the time while differing from the current dataset.
For a study comparing multiple years, verify that definitions remained consistent. A new reporting category or expanded collection system can create an apparent change that partly reflects how information was gathered.
Decide whether the data are suitable for the claim
A useful final test is to write the conclusion in the narrowest form the evidence supports.
If 62% of respondents in an opt-in customer survey favour a change, the evidence directly describes those respondents. Whether it supports a claim about all Canadians depends on the research design and its limitations.
If a government dataset describes annual provincial trends, it may support a provincial comparison but not necessarily an explanation of what happened in a specific neighbourhood.
Ask whether the conclusion requires information that the dataset never collected. If it does, the claim goes beyond its evidence.
Read the chart, not just its caption
Graphs compress complex datasets into visual impressions. That makes them valuable, but also vulnerable to misleading presentation.
Check axes, scales and missing periods
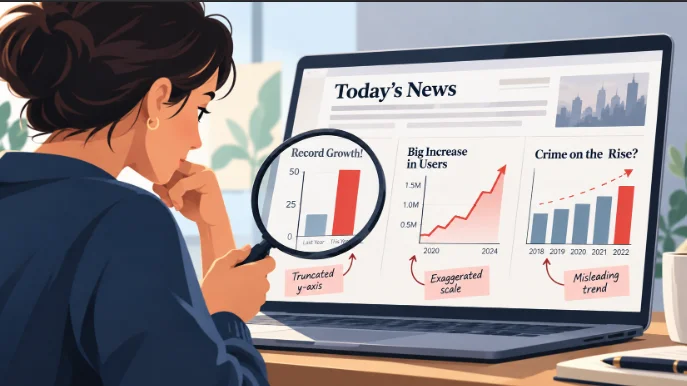
A bar chart comparing values of 100 and 105 looks modest when the vertical axis begins at zero. Starting the axis at 98 makes the difference occupy far more of the available height, exaggerating the apparent change.
Line charts are somewhat different. A non-zero baseline can be reasonable when examining small fluctuations over time, provided the scale is clearly labelled and does not disguise the magnitude of the movement.
Statistics Canada’s Data Visualization: Best Practices emphasizes consistent intervals, appropriate scales and clear labelling.
Recognising misleading graphs is a related skill, because the visual presentation can distort the story even when every plotted value is accurate.
Compare the visual message with the actual values
Read the numbers before interpreting the shape. A steep line may represent a tiny movement on a tightly cropped axis, while a nearly flat line may conceal a meaningful absolute change.
Check whether the graphic includes all relevant years and whether two series use different vertical scales. Dual-axis charts can make unrelated quantities appear to move together simply because their scales were chosen to create that impression.
When possible, inspect the original data table. If the graphic presents a long-term claim based on two observations, extend the comparison to an appropriate earlier period.
Separate poor design from false data. A confusing graphic does not prove that its figures are fabricated, but it should make you cautious about accepting the suggested interpretation.
Understand what surveys and polls can actually support
Opinion polls provide useful evidence about public attitudes, but their findings depend on the people surveyed and the way questions were asked.
Sample selection matters more than an impressive sample size
A survey with thousands of self-selected participants may be less useful for estimating population opinion than a smaller, carefully designed probability sample.
Probability sampling uses known selection probabilities. Non-probability approaches, including many opt-in online panels, do not provide the same basis for conventional sampling-error calculations.
Canada’s federal standards for online public opinion research explicitly distinguish these methods. For non-probability surveys conducted under those standards, researchers must not report a traditional margin of sampling error as though the respondents formed a probability sample.
Question wording and weighting also matter. A survey asking whether people support better public services may produce different responses from one emphasizing the costs required to provide them.
A narrow lead is not always a meaningful difference
A poll reporting 48% support and 45% opposition establishes a three-point lead among the reported responses. It does not automatically demonstrate a statistically significant population lead.
Uncertainty depends on the research design, and subgroup estimates may be less precise than the national results.
Reading opinion polls critically requires extra attention to sampling, uncertainty and the population the results actually represent.
A responsible headline should reflect those limitations rather than presenting every numerical lead as a decisive result.
Watch for certainty where only probability exists
Some statistical claims concern what might happen rather than what has already happened. Forecasts, risk estimates and winning chances can be useful, but they describe possibilities under particular assumptions.
A likelihood is not a promise
If an event has a 20% probability, that does not mean it must occur once in every five attempts. Probability describes the expected frequency across repeated comparable situations, not a schedule for individual outcomes.
Repeated observations may also be dependent. Yesterday’s conditions could influence today’s results, while other events may be effectively independent. The distinction matters when interpreting forecasts or patterns that appear unusually favourable.
A prediction is only as useful as its model, assumptions and available evidence. Even a well-calibrated forecast allows outcomes other than the one considered most likely.
Why risk, forecasts and winning chances need context
Suppose a hypothetical risk estimate increases from 1% to 2%. The relative increase is 100%, but the absolute increase is one percentage point. Both measures matter, particularly when the claim could influence someone’s decisions.
Similar problems appear in promotional prize draws and digital entertainment. A published chance of winning describes a probability, not a guarantee about an individual’s next result or eventual financial outcome.
The same reasoning is useful when interpreting winning odds and probability claims, where a stated chance can easily be mistaken for a promise about what will happen.
For consumer-facing claims, also distinguish a mathematical calculation from an assertion that a system is fair or independently verified. Those are different questions requiring different evidence.
A practical fact-checking walkthrough
Consider a hypothetical example involving a municipal transit system in British Columbia. The figures below are invented solely to illustrate the verification process; they are not findings about an actual transit authority.
The original headline
“Transit complaints soar 50% as service quality collapses.”
According to the fictional report, complaints increased from 40 in the first reporting year to 60 in the next.
The 50% increase is mathematically correct. But the phrase “service quality collapses” suggests a much broader conclusion than the complaint count alone establishes.
The source and calculation
Suppose the transit system expanded substantially during the same period. Its reported passenger journeys increased from two million to four million.
The figures can be compared in two ways:
| Measure | Year 1 | Year 2 | Change |
|---|---|---|---|
| Total complaints | 40 | 60 | +50% |
| Passenger journeys | 2 million | 4 million | +100% |
| Complaints per million journeys | 20 | 15 | −25% |
The total number of complaints increased, while the complaint rate per million journeys declined.
Neither observation proves that service quality improved or deteriorated. The higher count might reflect greater usage, more opportunities to submit complaints or changes in service delivery. The lower rate could conceal problems affecting particular routes or passenger groups.
Further checks would include whether the complaint categories remained unchanged, whether reporting became easier and whether the same geographic service area was covered in both years.
The calculation reveals that the original headline selected one measure while ignoring another directly relevant to the interpretation.
The corrected interpretation
A more careful headline would be: “Transit complaints rise in total, but fall relative to passenger journeys.”
The accompanying story could explain the expansion in service usage and investigate whether complaint categories, reporting practices or service reliability changed.
The original headline was not wrong about the percentage increase. It was unsupported in treating that increase as proof of a broader decline in service quality.
This distinction is central to fact-checking. You do not always need to label a statistic false. Sometimes the most accurate finding is that the number is correct but the interpretation leaves out essential evidence.
A decision framework for statistical claims
Different warning signs require different checks. Rather than applying the same questions mechanically to every story, identify what type of claim you are evaluating.
| What you notice | What to check | What it may reveal |
|---|---|---|
| A dramatic percentage increase | Original and new totals, denominators and reference periods | A small absolute change or a shifting comparison base |
| An alarming chart | Axis scale, time range, units and original values | Visual exaggeration or missing historical context |
| A confident polling headline | Sampling method, question wording and uncertainty | An overstated finding or unsupported population estimate |
| A claim about an entire population | Geographic and demographic coverage | An inappropriate generalisation from a limited group |
| A guaranteed-sounding prediction | Probability assumptions and model limitations | Uncertainty presented as certainty |
| A number without a source | Original study, dataset or official publication | A claim that remains unverified |
These checks lead to three useful outcomes.
Supported: The available evidence confirms the claim, and the wording accurately reflects what was measured.
Misleadingly presented: The number exists, but its selection, comparison or interpretation creates an impression the evidence does not fully support.
Unverified: The underlying evidence cannot be located or is insufficient to establish whether the statement is accurate.
Sometimes the source directly contradicts a claim. In that case, describe the specific factual error rather than treating it as merely unverified.
A limitation is not automatically evidence of deception. Surveys have uncertainty, datasets contain exclusions and visualizations involve design choices. What matters is whether those limitations are acknowledged and whether the conclusion remains defensible.
What to do before sharing a statistic
A social media post may give you only a screenshot, a dramatic percentage and a few words of explanation. That is usually enough to recognize a claim worth checking, but not enough to confirm it.
Before repeating a surprising statistic, make five quick checks:
- Find the source. Identify who produced the figure and whether the original report or dataset is available.
- Check the denominator. Establish what population, total or quantity the percentage describes.
- Examine the comparison. Confirm the dates, geography and measurement definitions.
- Look for uncertainty. Determine whether the result is an estimate, a survey finding or a complete count, and whether relevant limitations are disclosed.
- Test the conclusion. Ask whether the headline says more than the evidence establishes.
Not every statistic needs a lengthy investigation. A straightforward figure from a clearly identified official source may be easy to verify. A surprising claim without a date, denominator or accessible methodology deserves considerably more caution.
When evidence remains incomplete, avoid filling the gaps with assumptions. You can say that a number has not been verified without declaring it false, or acknowledge that a reported change occurred without accepting the explanation attached to it.
The most effective defence against misleading statistics is a simple habit: before reacting to what the number appears to say, establish what it actually measures. A percentage may be accurate, a graph may look convincing and a source may be reputable. The conclusion still has to earn your trust.