How to Find the Original Source Behind a News Statistic

A news headline says unemployment has jumped, a social media post claims a survey proves something, or an article quotes a startling percentage without explaining where it came from. The number looks precise, but precision is not the same as evidence. Before deciding whether to trust it, you need to find out who produced the figure, what they measured and whether the claim matches the original findings.
You can often trace a statistic to its source in a few minutes. The trick is to follow the evidence backwards rather than searching for more articles that repeat the same number.
The quickest approach: Search for the exact figure alongside a distinctive phrase, identify the organization that collected the data, locate its original report or statistical table, and check the date, population and definition. Finding a matching number is the beginning of verification, not the end.
Start with the exact claim, not the headline
Headlines compress complicated findings into a handful of words. They are useful for attracting attention, but they often leave out the details needed to judge a statistic.
Imagine seeing a post with this headline: “Canada’s unemployment rate jumps to 6.5%.”
Before searching, separate what can be checked from what the wording encourages you to believe. The figure of 6.5% is a measurable claim. The word “jumps” is an interpretation. Whether it accurately describes the change depends on the previous rate and the period being compared.
Separate the number from the interpretation
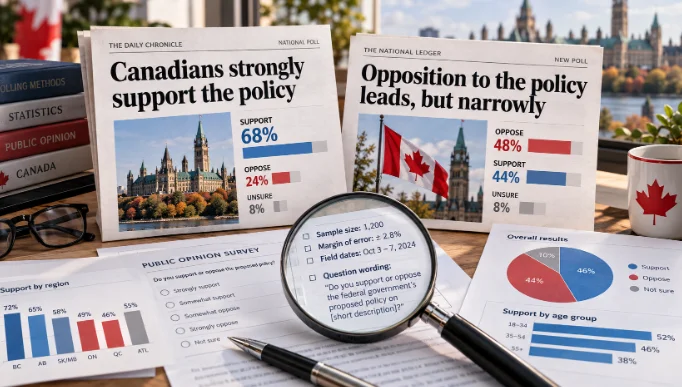
A percentage can be correct even when the conclusion attached to it is misleading. A survey might find that 60% of respondents support a proposal, but a headline claiming that “Canadians overwhelmingly support it” raises questions about the sample, the wording of the question and the strength of that support.
Write down the factual claim without the dramatic language. Instead of investigating whether unemployment has “surged,” investigate the unemployment rate for the specified month and how much it changed. This gives you something concrete to verify.
Capture the wording, date and population
Record four details before opening another tab:
- The statistic: The exact number, percentage or comparison.
- The period: The month or year the figure describes, which may differ from the article’s publication date.
- The population: Who or what was measured, such as adults aged 18 and older, employed people or households.
- The geography: Canada, a particular province, a municipality or another defined area.
If some details are missing, treat them as questions to answer rather than filling in the gaps yourself. A figure about Ontario is not automatically a national figure, and a survey of university students does not describe every young adult.
Follow the statistic back to its source
The fastest way to check where a number came from is to work backwards through the reporting chain. An article may quote a research company’s press release, which summarizes a report, which draws on a dataset. Each step can introduce rounding, missing context or a different interpretation.
Search the exact phrase and unusual numbers
Start with Google Search or another search engine. Put distinctive wording in quotation marks, then combine it with the figure, year or suspected source.
For example, to investigate a reported unemployment rate from September 2026, useful searches include:
"6.5%" "September 2026" unemployment CanadaStatistics Canada unemployment September 2026site:statcan.gc.ca "Labour Force Survey" "September 2026""14-10-0287-01" unemployment
Quotation marks help locate exact wording. The site: operator limits results to a particular domain, while a table number can lead directly to an official data product.
Do not assume the first search result is the original source. An established news outlet may rank above the research organization, and several websites may have copied the same press release. Look at the result titles and dates before opening them.
For academic claims, Google Scholar can help locate the underlying paper using a study title, author’s name or distinctive phrase. Check the publication year and whether the result is a peer-reviewed article, preprint, conference presentation or another type of publication. They are not interchangeable.
Move past articles and press releases
Different sources serve different purposes. A social media post usually offers the least methodological detail. A news report may identify the research and explain its significance. A press release or research summary can provide useful background but may emphasize findings selected for public attention.
The original study or statistical table is generally where you can inspect what was actually measured. Its methodology explains how the information was collected and which limitations affect the results.
For government data, look for a dataset identifier, catalogue number, methodology page or downloadable table. For research studies, look for the paper, its supplementary material and any available data documentation.
A press release issued by the organization that conducted a survey is closer to the evidence than a news article quoting it, but it is not necessarily the complete primary source. Whenever possible, continue to the results and methods.
Use Statistics Canada as a worked example
Consider a hypothetical social media headline based on real figures: “Canada’s unemployment rate jumps to 6.5% as employment falls by 68,000.”
Searching for the rate, month and Statistics Canada leads to the October 9, 2026 edition of The Daily, the agency’s official release service. The publication is titled Labour Force Survey, September 2026.
The release reports that Canada’s unemployment rate was 6.5% in September, up 0.1 percentage points from August. Employment declined by an estimated 68,000 people, or 0.3%, over the month.
Those figures confirm the numerical basis of the hypothetical headline. They do not, by themselves, justify calling the increase a dramatic jump.
The release also identifies Statistics Canada Table 14-10-0287-01, titled Labour force characteristics, monthly, seasonally adjusted and trend-cycle. This is the next stop in the verification process.
- Find the official release. Search for the publication title and confirm its October 9, 2026 release date.
- Identify the underlying table. The release lists Table 14-10-0287-01 as the source for the unemployment and employment figures.
- Inspect the relevant observations. In the table viewer, select Canada, the appropriate gender and age categories, the unemployment rate, the seasonally adjusted series, and August and September 2026.
- Check the methodology. Consult the Labour Force Survey documentation to understand the population, definitions, sampling and seasonal adjustments.
The table can be customized by geography, age, gender and statistical measure. That matters because an apparently contradictory number may come from a different selection rather than an error. A seasonally adjusted rate should not be casually compared with an unadjusted estimate.
There is another useful distinction. A decline of 68,000 in the estimated number of employed people is a net change in survey estimates. It does not establish that exactly 68,000 individuals were laid off. Some people may have left jobs while others found work, and changes in survey estimates reflect more than a count of layoffs.
At this point, the original statistic has been traced through the official release to its data table and underlying survey method. The remaining question is whether the headline describes it fairly.
Check whether the source actually supports the claim
A source citation is useful only when the cited material supports the specific statement being made. A legitimate report can be quoted inaccurately, and the correct figure can be applied to the wrong population or period.
Match the year, geography and population
Return to the unemployment example. Statistics Canada’s September 2026 release reports a national unemployment rate of 6.5%, while British Columbia’s rate was 6.4%. The two figures come from the same survey release but describe different geographic populations.
A post stating that BC’s unemployment rate was 6.5% would therefore not match the provincial result, even though the number appeared prominently in the national release.
The time period matters just as much. Monthly changes, year-over-year comparisons and multi-year trends answer different questions. A statistic may describe September 2026, a previous calendar year or an average across several periods. The article’s publication date is not a substitute for the data’s reference date.
Check the age range too. A finding about people aged 15 to 24 should not be described as a finding about all workers. If a report combines several provinces, age groups or income categories, verify which combination produced the quoted percentage.
Check whether the definition has changed
Every statistic depends on a definition. In the Labour Force Survey, the unemployment rate is the number of unemployed people expressed as a percentage of the labour force, which includes employed and unemployed people. It is not the percentage of the entire population without a job.
People who are not working but are outside the labour force are not automatically counted as unemployed. The survey applies specific criteria involving job search, availability for work and certain other circumstances.
This distinction explains why the unemployment rate and employment rate are not opposites that add up to 100%. The employment rate uses the working-age population as its denominator, while the unemployment rate uses the labour force.
Definitions can also change over time. A study may revise its questions, expand its coverage or alter how a category is classified. When comparing figures from different years or institutions, inspect the methodology notes for changes and any warnings about comparability.
Statistics Canada’s data-literacy guidance recommends examining sources, methods, definitions, accuracy and context before drawing conclusions. These checks apply just as readily to a commercial survey as to official government data.
Watch for meaning lost between the source and the story
Finding the original number is only part of the job; understanding how statistics can mislead readers also means checking what the headline leaves out.
Consider how these interpretations compare with the underlying September 2026 Labour Force Survey figures:
| Claim or wording | What the source establishes | Assessment |
|---|---|---|
| “Canada’s unemployment rate was 6.5%.” | The national rate was 6.5% in September 2026. | Supported when the period is identified. |
| “Unemployment jumped to 6.5%.” | The rate rose from 6.4% to 6.5%, a 0.1-percentage-point increase. | The number is correct, but “jumped” overstates the movement. |
| “68,000 workers were laid off.” | Estimated employment declined by 68,000 on a net basis. | Not supported as a count of layoffs. |
| “BC’s unemployment rate reached 6.5%.” | The BC rate was 6.4% in September 2026. | Contradicted by the provincial figure. |
These are illustrative claims, not quotations attributed to particular news outlets. They show why checking the wording matters as much as confirming that a number exists.
Percentage points are not percentage increases
Suppose a survey reports that a proportion increased from 10% to 15%. That is a rise of five percentage points, but a 50% relative increase.
Both descriptions can be mathematically correct. They communicate different things. Saying the figure “rose by 5%” would be inaccurate if the intended meaning was a five-percentage-point change.
When a news story describes a dramatic increase, look for the starting value. A relative increase can sound enormous when the original figure was small. Whenever possible, compare both the percentage and the underlying count.
A national figure does not describe every province
A Canada-wide average can conceal substantial provincial differences. National results reflect the population and measurement framework used to calculate them; they do not mean that every province recorded the same rate or trend.
In the September 2026 labour figures, British Columbia’s unemployment rate fell slightly from the previous month while the national rate rose. Both statements are supported by the same Statistics Canada release.
For a claim about a local community, the geographic level may need to be narrower still. Provincial averages cannot automatically describe a particular municipality, and some smaller-area estimates use different time frames or have greater statistical uncertainty.
What to do when the original data cannot be found
Not every search ends with a downloadable spreadsheet. Some reports cite unpublished surveys, proprietary commercial datasets or academic papers behind paywalls. Older articles may contain broken links, and a statistic can circulate for years after its original context has disappeared.
Recognize an untraceable claim
If the first search fails, try the research organization’s name, the study title, the author’s surname or an unusual phrase from the reported finding. Search for a report PDF, a catalogue number or a digital object identifier (DOI).
For academic studies, Google Scholar, a university library catalogue or the publisher’s website may identify the paper even when the complete text is unavailable. A library may also provide access to subscription material.
Sometimes the cited source is simply not public. You can contact the author or publisher and ask for the study title, data source, reference period and methodology. A newsroom may also be able to clarify which report or table it used.
Before concluding that a statistic has no source, check whether you are dealing with a revised dataset. Statistical agencies sometimes update historical estimates or publish new versions of tables. An older report may reflect the data available at publication, while the current table contains revised values.
Failure to locate an original source does not prove that a claim is false. It means the available evidence is insufficient to verify it independently. That is a meaningful distinction.
Decide what you can responsibly conclude
For everyday fact-checking, three practical classifications are often enough:
- Supported: The original evidence confirms the statistic, and the claim accurately describes its period, population and meaning.
- Misleadingly presented: The source contains the number, but the headline or accompanying explanation exaggerates the change, removes essential context or draws an unsupported conclusion.
- Unverified: The original evidence cannot be located or does not provide enough information to establish whether the claim is correct.
If the source directly contradicts the stated number, describe the specific error rather than forcing it into the unverified category. A figure can be demonstrably wrong, and the evidence should make clear why.
For a claim you intend to quote, keep a short record of the original wording, source title, publication date, table or study identifier, and any limitations you found. That record makes it easier to revisit your assessment if the data are later revised.
You do not need to become a statistician to check a number in the news. You need to know what was claimed, where the evidence came from and whether the two genuinely match. Once you can follow a statistic back to its source, a confident headline no longer has to do the thinking for you.